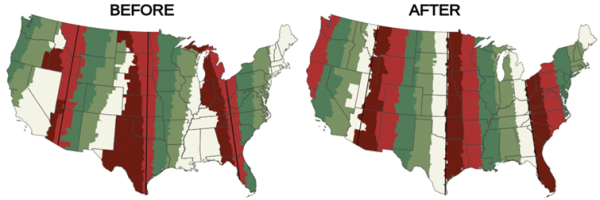
March 5, 2024 – In conjunction with fixDST.com, the most recent work at DSTmap are three interactive maps that add a new flavor to the Daylight Savings Time debate. Three thousand counties are individually covered. The maps show vast differences between counties. You can quickly get a picture of DST options that apply in your home county. Whether your interest is in permanent standard time, permanent DST, or some intermediate option, you can see how each option plays out in your own backyard.
For example, when you move the cursor due west from Washington, DC to Terre Haute in Vigo County, IN, you go from 38% of early mornings being dark in Washington, to 70% being dark in Vigo. Washington and cities on the East Coast typically have far fewer dark mornings than experienced on the western edges of time zones. What is generally unknown is that with a time-zone fix, Vigo would have had only 20% dark mornings, far better than the vast majority of counties on the East Coast and better than the 24% in Santa Barbara, CA.
Prior to DSTmap’s interactive maps, you would not be able to get such information. More particularly, you would not have been able to get other DST information that addresses your particular Daylight Savings Time concerns.
For this DST season, visit fixDST.com

About DSTmap and fixDST:
DSTmap provides an introduction to using interactive maps to evaluate time zones & options ranging from no DST to continuous DST.
fixDST illustrates the use of the three interactive maps as they apply to Daylight Saving Time decision making.
Media Contact
Company Name: Ike Jeanes
Contact Person: Media Relations
Email: Send Email
Phone: 540 739 0892
Country: United States
Website: http://dstmap.com/
