Economists are becoming more positive on this year’s economic prospects.

In its April World Economic Outlook (WEO), the IMF now forecasts aggregate GDP growth to reach 3.2 percent this year, up 0.3 percentage points from its October projection. The Fund describes the global economy as “surprisingly resilient” for the way in which it has continued to grow despite the higher interest rates needed to rein in inflation.
In this vein, China’s National Bureau of Statistics (NBS) provided better-than-expected economic news when it released its National Accounts for the first quarter. China’s GDP grew by 5.3 percent year-over-year beating the 5.0 percent forecast of the Chief Economists surveyed by the Yicai Research Institute.
While growth in Q1 was similar to last year’s outturn (5.2 percent), its composition was quite different (Figure 1). Most importantly, net exports were a drag on growth in 2023, but they contributed positively in Q1. On the other hand, investment’s contribution dropped significantly while consumption’s was slightly smaller.
Figure 1

GDP growth in Q1 was even more impressive when looked at on a quarter-over-quarter basis (Figure 2). The 1.6 percent growth recorded in Q1 was well above the average of last year’s quarterly rates. Quarterly growth of 1.6 percent translates into 6.6 percent at annual rates. With most estimates of China’s potential growth in the 4.5 to 5.5 percent range, Q1’s strong performance likely narrowed China’s excess supply gap.
Figure 2

In dollar terms, China’s exports were up 1.5 percent in the first quarter, compared to a 1.9 percent fall in the same period a year ago. China’s exports to the US continued to fall but the decline this year (-4 percent) was significantly smaller than last year (-17 percent). It appears that robust demand in the US is, to some extent, offsetting the effects of the tariffs on its imports from China.
On a 12-month average basis, China’s exports are down 6 percent from their September 2022 peak (Figure 3). Nevertheless, they are up by more than a third from their pre-pandemic level. China’s ability to maintain competitive export levels even as its GDP growth has decelerated has led to the narrative that it is “exporting its over-capacity”. However, looking at the structure of China’s economy, it is difficult to find a factual basis for this story.
Figure 3

China does not export a particularly high share of its output. In recent years, China’s merchandise exports have been below a fifth of its GDP. This is about half as much as Germany and Korea and pretty close to Japan’s share.
But merchandise exports are only part of the trade story. Imports are often a crucial component of a country’s ability to export. Moreover, trade in services has become increasingly important. Economists like to look at the ratio of the current account balance to GDP as the most comprehensive measure of a country’s external position.
Looking at the data this way, there is nothing unusual about China’s economy. In recent years, its current account surplus has been around 2 percent of GDP – a smaller ratio than in Germany, Korea and Japan (Figure 4).
Figure 4

China has rapidly become competitive in high-value-added markets like autos. But its emergence as an auto-exporting power is not unique, rather it is reminiscent of Japan’s experience in the 1980s and Korea’s in the 2010s.
What makes China stand out is not the structure of its economy but its size. Because China is so large, the evolution of its economy can have disruptive effects on its trading partners. The fear of China flooding the world with its products is an old story too. Indeed, in acceding to the WTO, China had to accept unique rules that allowed its trading partners to protect their markets by restricting the amount China could export.
The Chinese economy is driven by domestic demand. As Figure 1 shows, domestic demand accounted for 85 percent of GDP growth in Q1, with consumption making the largest contribution.
In Q1, consumption was supported by both strong income growth and a decline in the savings rate. Although it has fallen well below its 2020 peak, the household savings rate remains more elevated than pre-pandemic levels (Figure 5). This means that there is still scope for household confidence to reduce precautionary savings and fuel consumption as the year progresses.
Figure 5

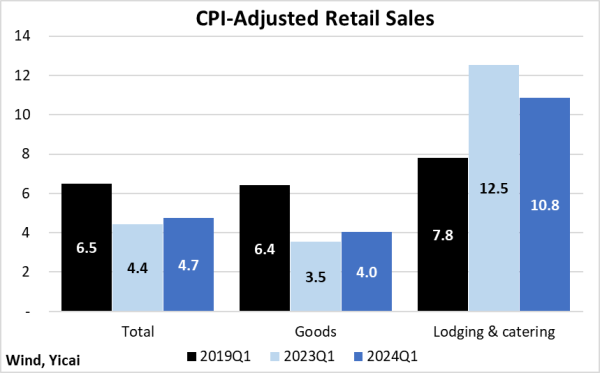
Adjusting for CPI inflation, retail sales in the first quarter grew more rapidly than in the same period a year ago. However, their growth was still much slower than in 2019Q1 (Figure 6). The weakness seems confined to the goods category, as lodging and catering sales this year grew more rapidly than pre-pandemic rates.
Figure 6

The Chinese consumer’s willingness to spend on travel continued in the second quarter. The Ministry of Tourism and Culture reported that travel and spending for the Qing Ming (Tomb Sweeping) Festival exceeded pre-pandemic levels by significant amounts (Figure 7).
Figure 7

The strong consumption of these services – which appear to be discretionary rather than necessary – suggests that household confidence is intact. I believe that much of the sluggishness in goods consumption stems from the weakness in the property market.
Within the goods category, autos remain a bright spot (Figure 8). Year-to-date, sales are 11 percent higher than in January-March 2023. Almost all of the growth came from purchases of New Energy Vehicles (NEVs), which were up 28 percent year-over-year in Q1. Sales of passenger cars with internal combustion engines were only up 2 percent. In March, NEVs accounted for 40 percent of the passenger cars sold, up from a third in March 2023.
Figure 8

While the economy, in general, looks pretty good, conditions in the property market continue to deteriorate. New home sales fell to 189 million square meters in the first quarter, down 28 percent from last year (Figure 9). Starts of new homes fell by a similar percentage to a level not seen since the first quarter of 2005.
Figure 9

Housing inventories have continued to rise. At close to 5.5 months of sales, they have exceeded the peak of the 2015-16 cycle (Figure 10).
Figure 10

Sheng Laiyun, the NBS’s Deputy Director, explained that the three major projects – building affordable housing, constructing public infrastructure and transforming urban villages – have been effective in boosting real estate development. Moreover, various regions have implemented supportive policies including easing purchase restrictions and lowering provident fund interest rates.
Looking ahead, Sheng noted that the rapid expansion of real estate experienced over the past 20 years may not be sustainable. Nevertheless, continued urbanization and upgrading of living conditions, as incomes continue to rise, will underpin the property market’s healthy development.
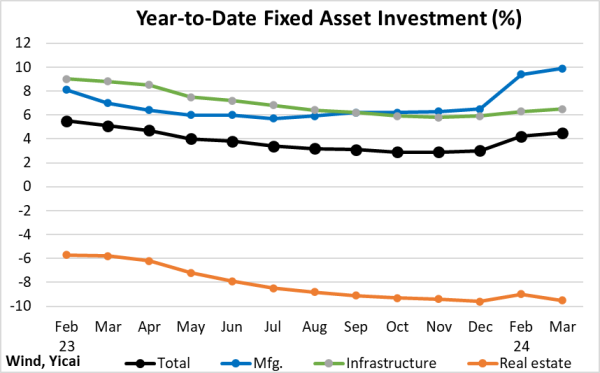
Fixed asset investment (FAI) increased by 4.5 percent in the first quarter, somewhat more slowly than the 5.1 percent recorded in January-March 2023 (Figure 11). Last year, FAI growth slowed steadily and dropped to 3 percent for the year as a whole. This year, there has been an encouraging rebound in investment in the manufacturing sector, which is up close to 10 percent year-over-year.
Figure 11

As a result of the weakness in the property market, real estate’s share of overall FAI fell from close to 29 percent in 2020-21 to 22 percent last year – the same share as in 2010 (Figure 12).
Figure 12

Less economic activity devoted to real estate could be good for China’s long-run development. And, while the prices of homes have fallen, housing in China remains expensive by international standards. The first quarter’s data suggests that the transition to less real estate in GDP can be achieved without sacrificing growth. The challenge will be to maintain this pattern of development over the next several quarters.
In its April WEO, the IMF predicts that the Chinese economy will only grow by 4.6 percent this year. I wonder if the strong start in Q1 will encourage the Fund to revise up its projection. The IMF has been quite bearish on China’s prospects. Last April, the Fund predicted that China’s growth would only reach 4.5 percent in 2023. In the event, the economy grew by 5.2 percent (Figure 13).
While economic forecasting is difficult, I wonder if the IMF’s errors are telling us something.
Figure 13

Media Contact
Company Name: Yicai Media Group
Contact Person: Zhu Liming
Email: Send Email
Country: China
Website: https://www.yicaiglobal.com/
